
Platform updates
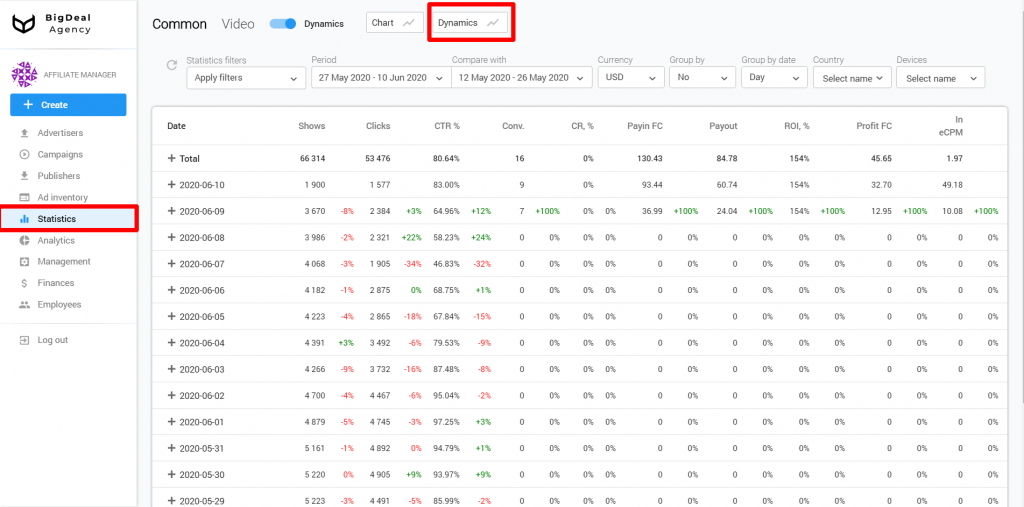
The Dynamics chart appeared in the Statistics section
The new graph allows you to compare metrics in the context of three selected dates.
Click on the Dynamics field to go to the chart.
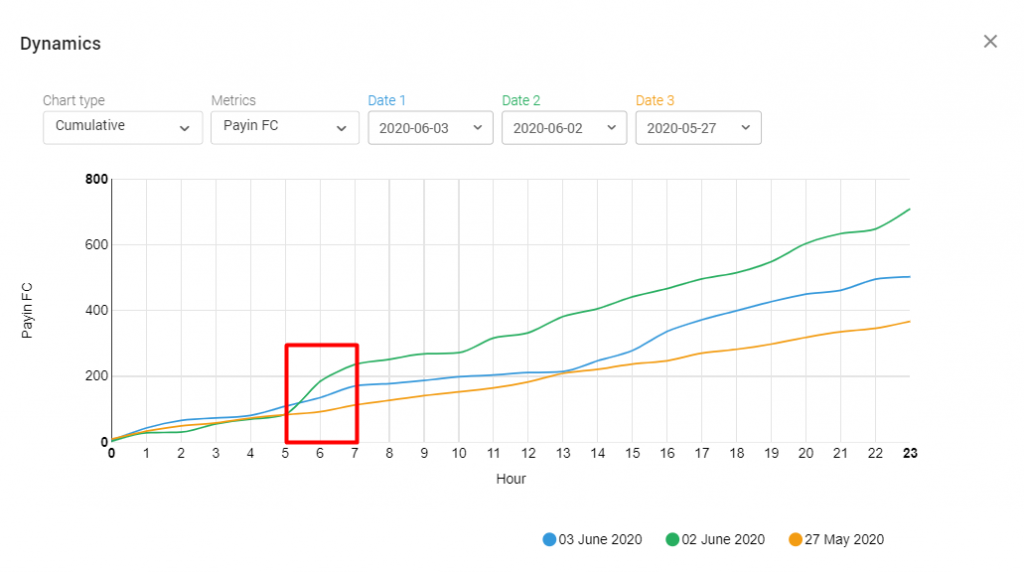
Set the dates and metrics you want to analyze in the window that appears.
Using the drop-down list Chart Type, you can create a table in one of two formats:
Cumulative. The data for each hour are sequentially summarized. Because of this, you can track the dynamics of changes in statistics per day. The graph shows that on June 3, the affiliate program received fewer payments for ad impressions than on June 2. The table displays the exact time of events.
By Values. Here you can see the data in one hour. The previous chart showed that the affiliate program received more payments on June 2. If we change the format of the table, we will see that the flow of funds sharply rose on June 2 at 6 a.m. Please, keep in mind that the platform uses the UTC +0 time zone.
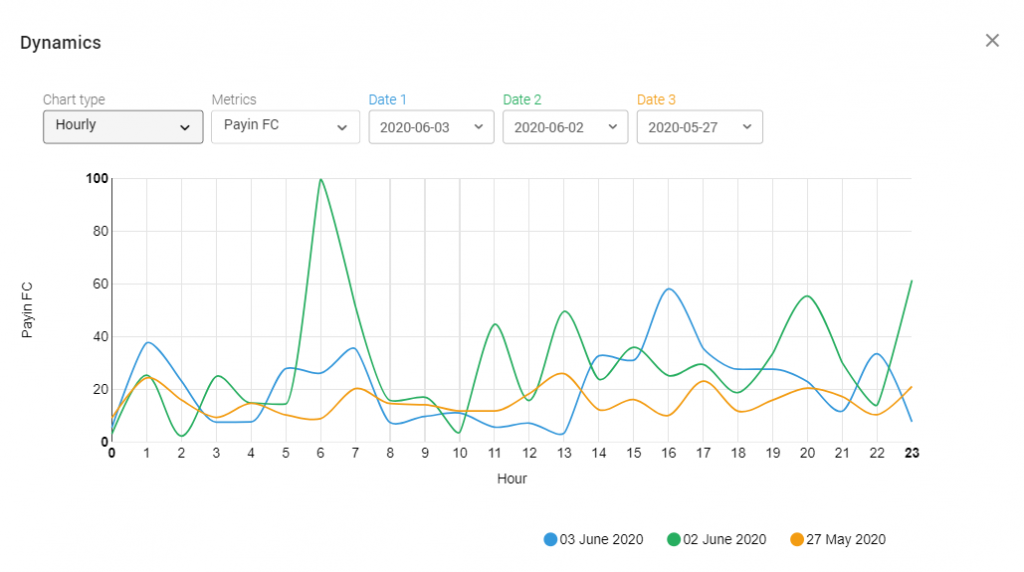
If there wasn’t a second chart, you could conclude that the metrics for June 2 are higher than for June 3. However, the By Values table indicates the presence of anomalies in statistics for June 2. You need to study them.
Knowledge base
A new article has been added:
